Adam Pearce


An interactive map made for visualizing.org’s Meteorites contest.
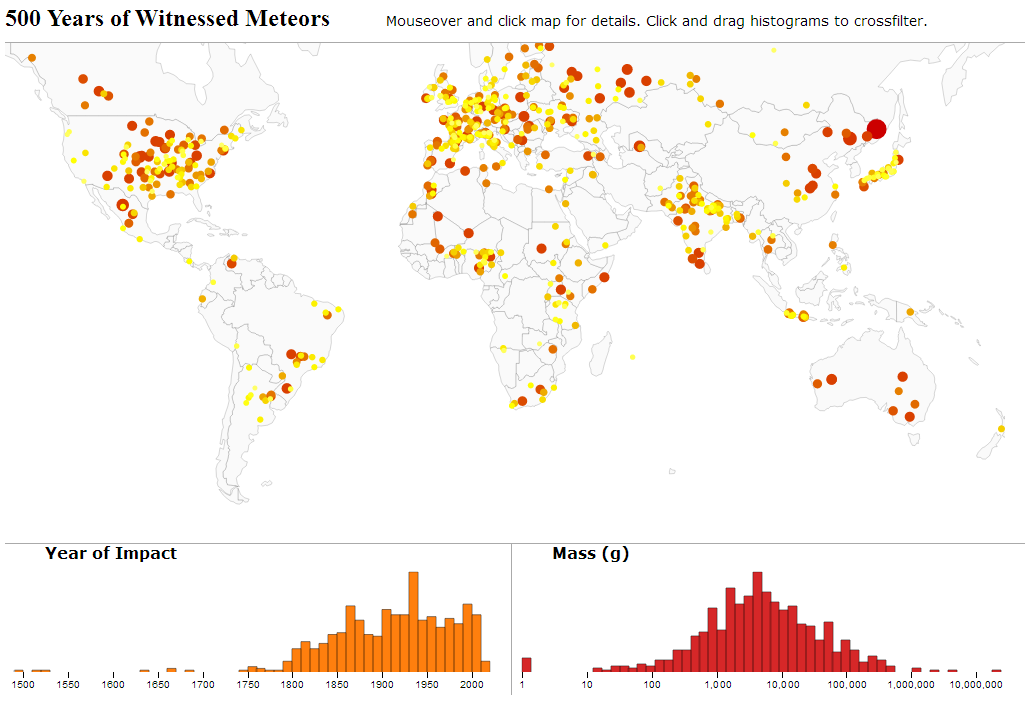
I started from ‘scratch’ with a blank map of the world generated by d3. Each meteor in the contest data set had a latitude and longitude, so I used those coordinates to plot a small circle on the map to represent each impact. After coloring the circles orange, the map looked almost like the one above.
Most of the ~30 hours I’ve spent working on this map were spent adding some of these small improvements:
Ultimately, I ended up with a presentation pretty close to Javier de la Torre’s:

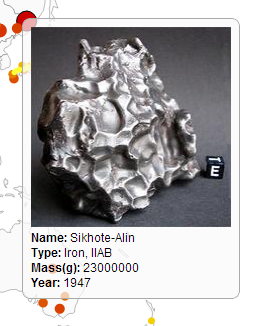
I think my version has a number of improvements (obviously, I just finished making it!) – the better looking tooltips which active on mouseover not on click, the crossfilters, dotmap instead of heatmap (I really don’t like what happens to their contiguous areas on zoom) - but Torre apparently made his in only 30 minutes. I don’t regret the additional time spent on mine since most of it was spent learning, but cartodb or fusion tables look like they would be the appropriate tool to use the vast majority of the time. I am a little frustrated I wasn’t able to do more with the flexibility of d3 - the only other published entry for the contest I’ve seen, bolid.es, is stunning – and I’m looking forward to seeing what else gets made.